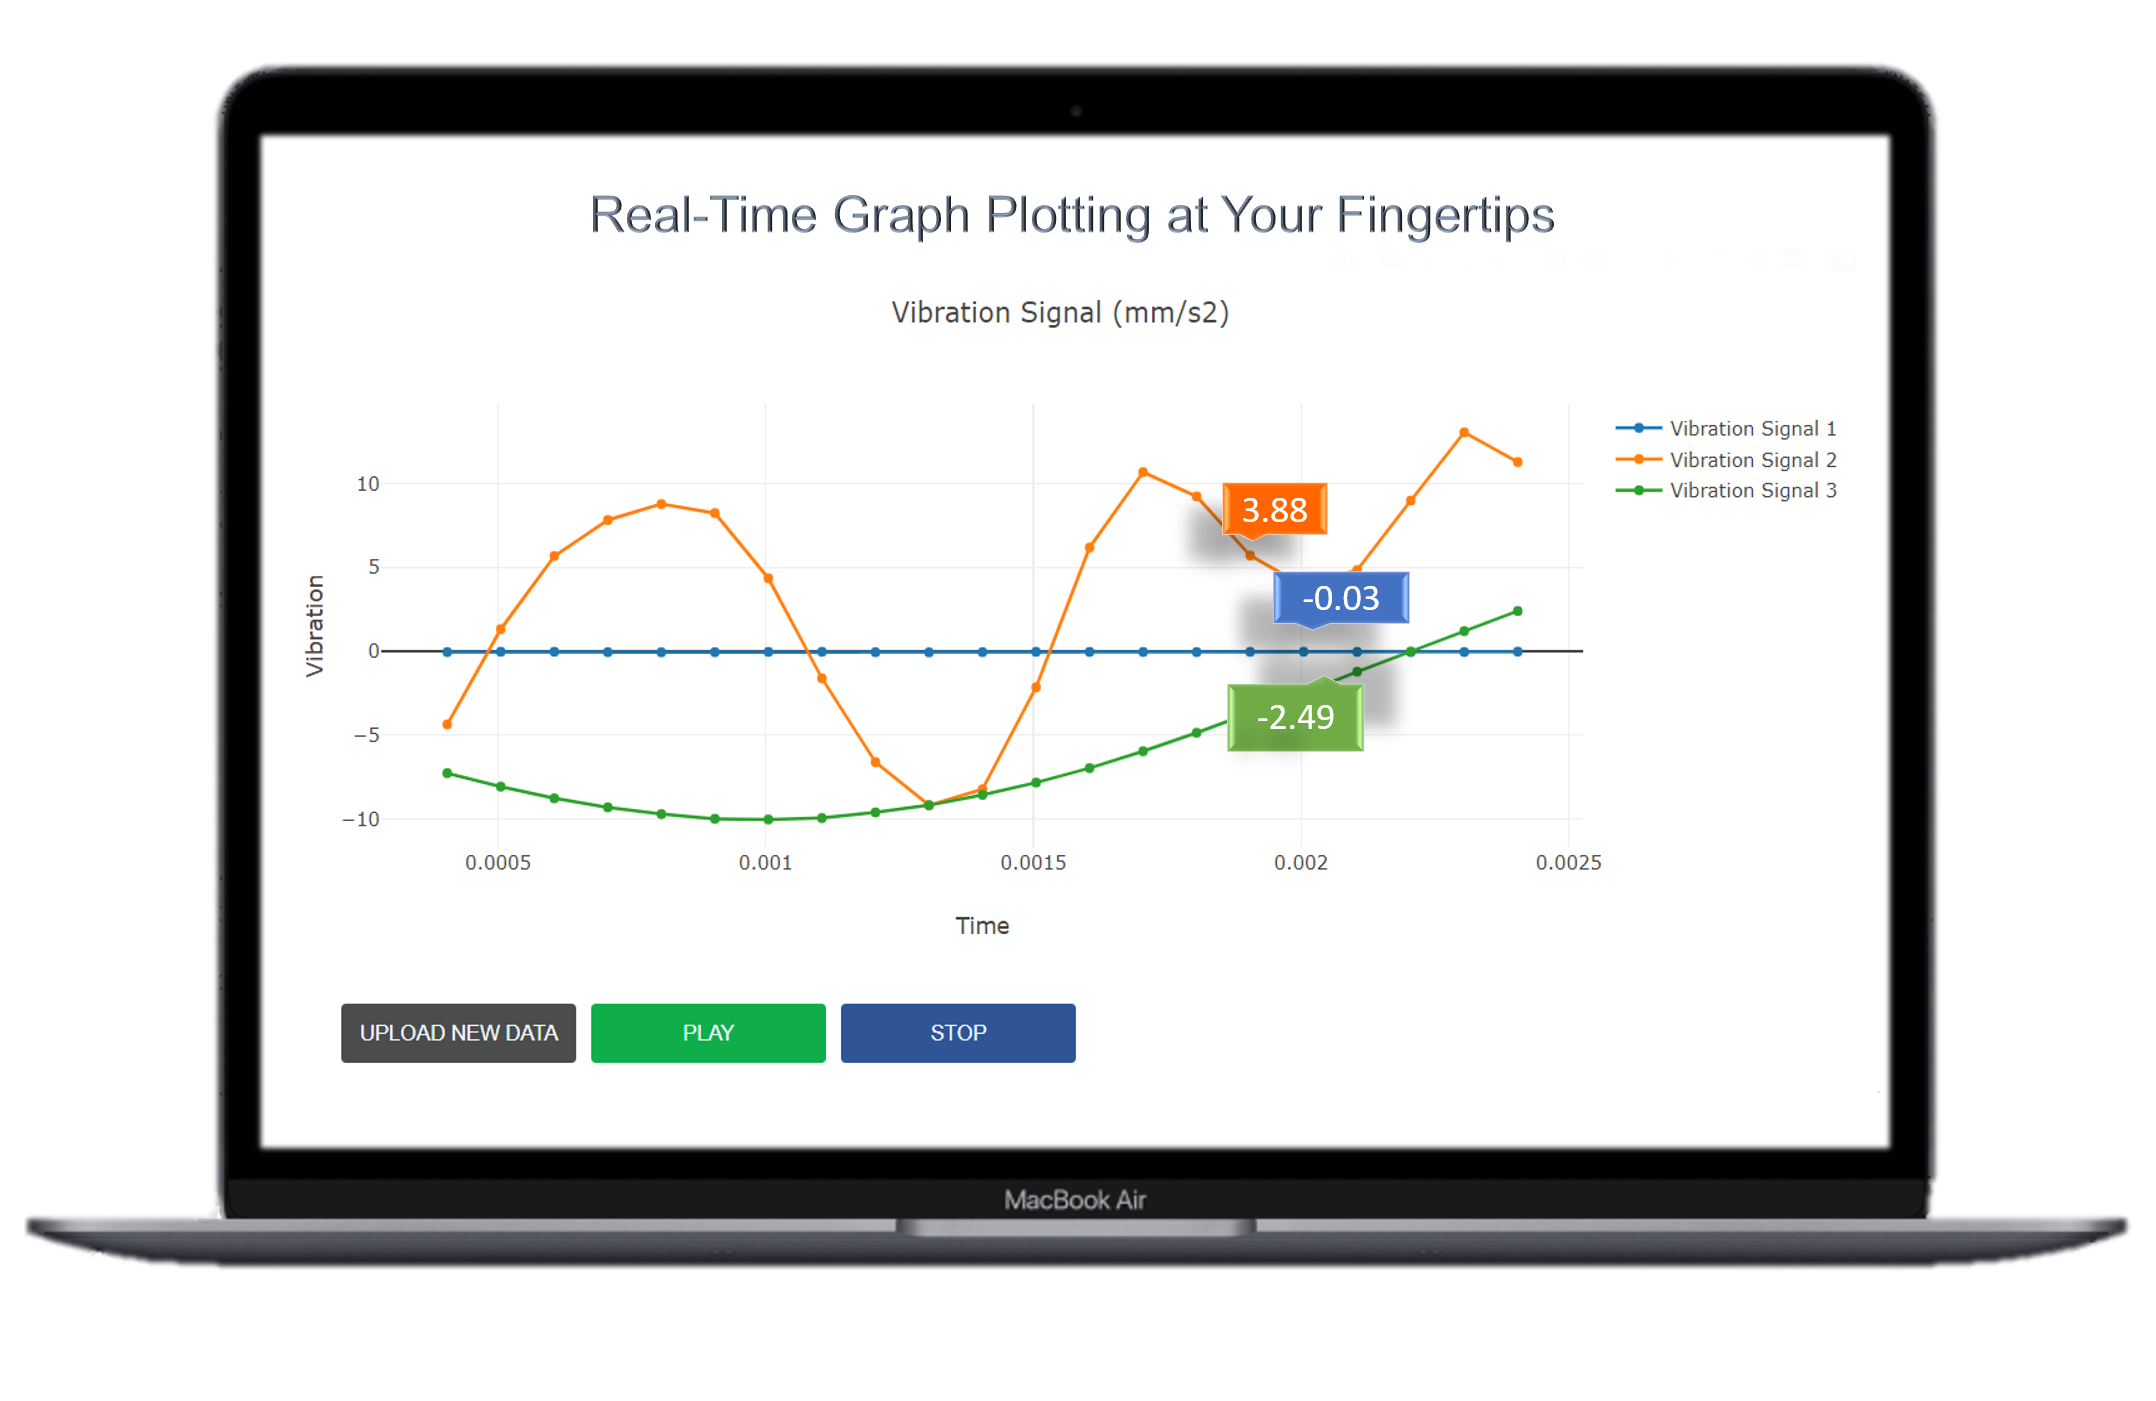
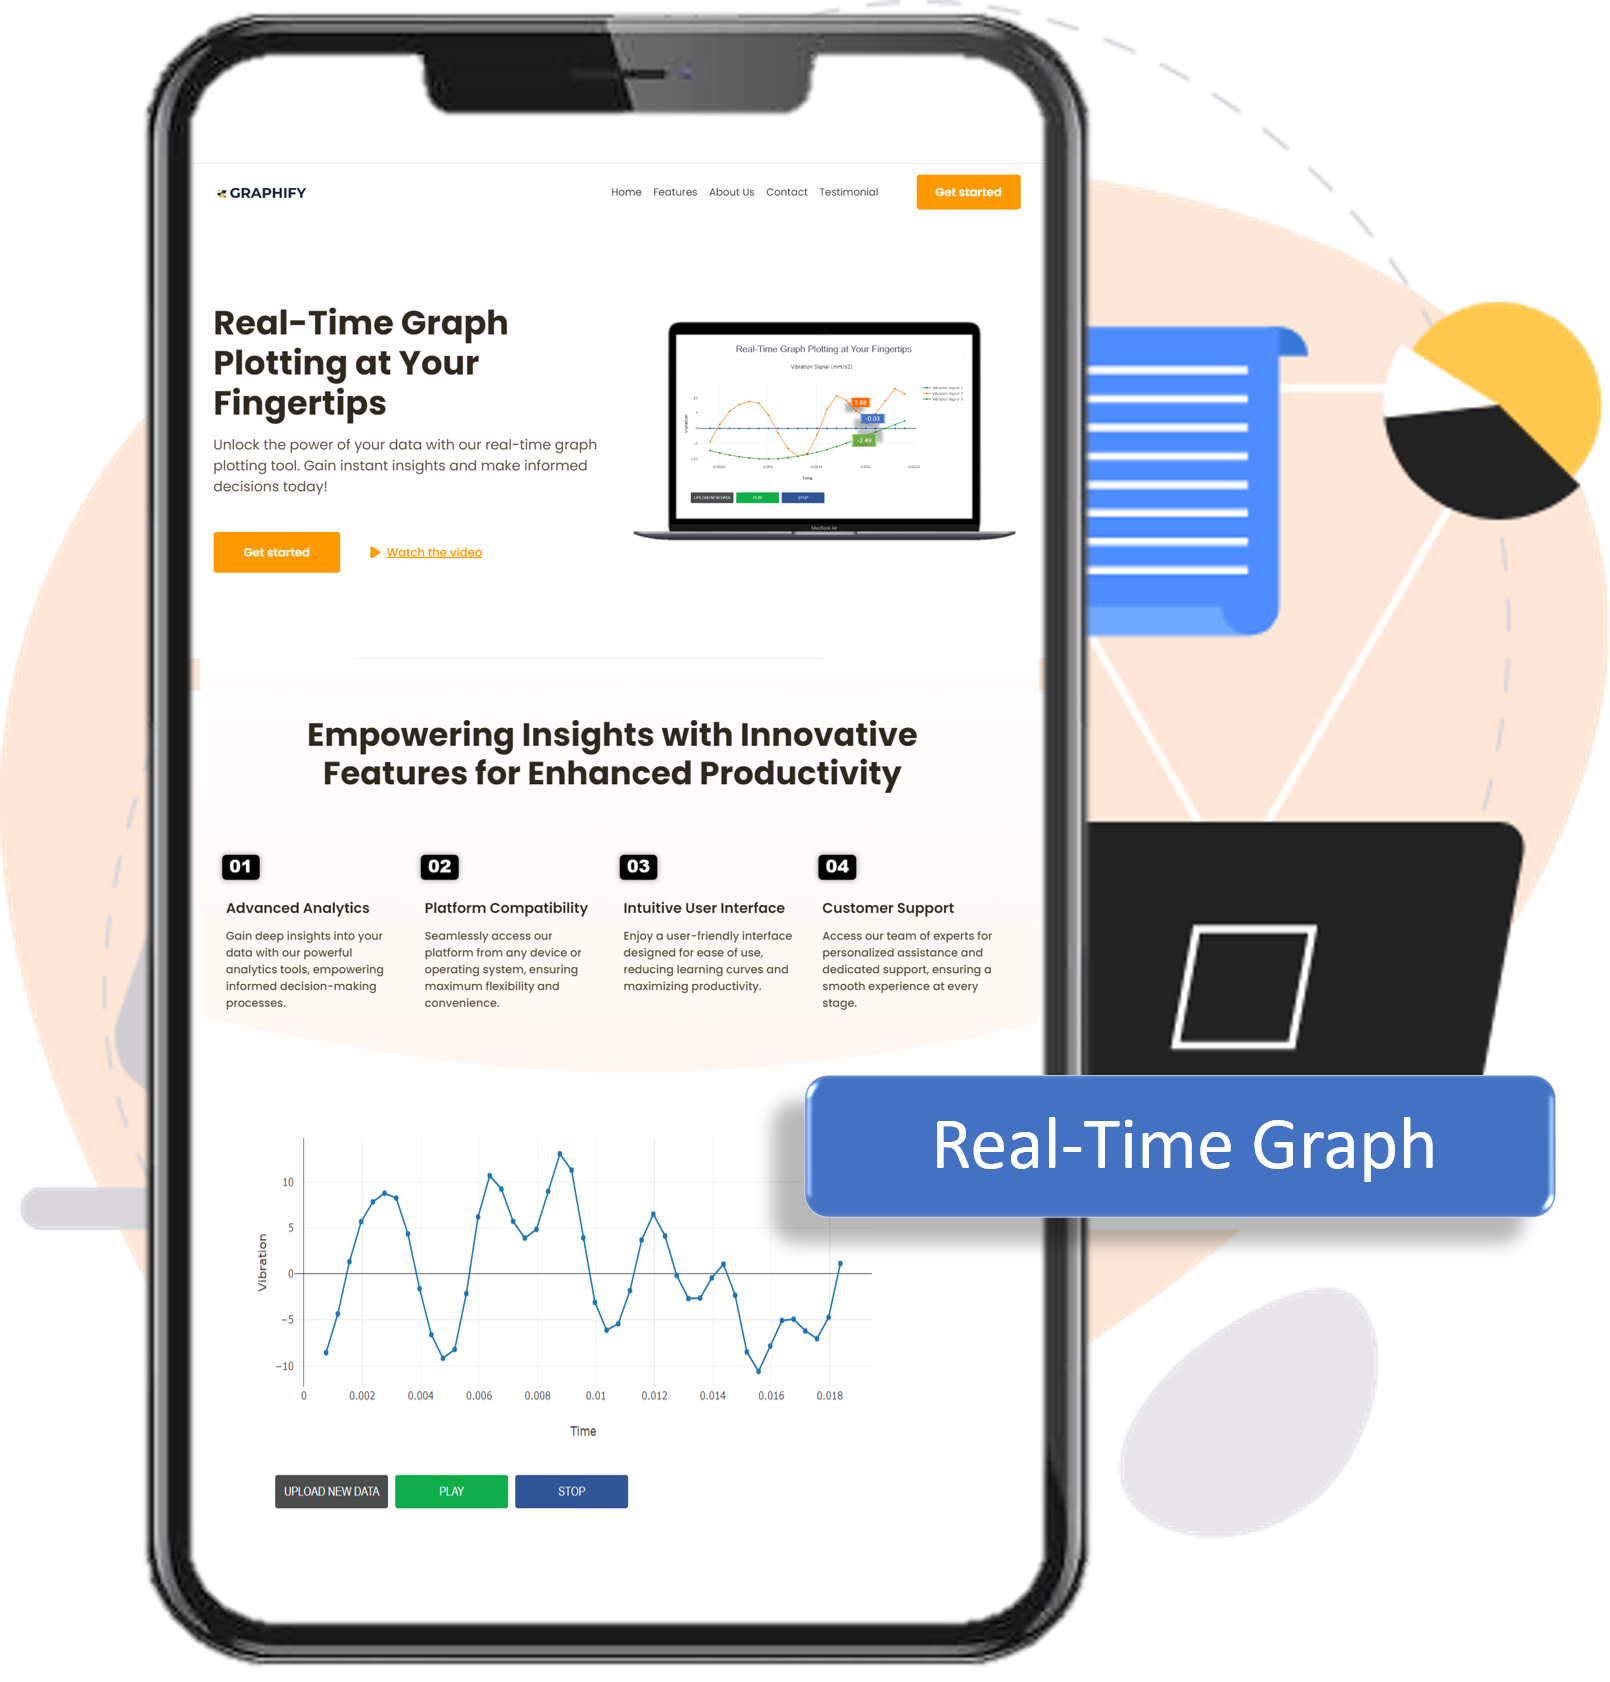
Real-Time Graph Plotting at Your Fingertips
Unlock the power of your data with our real-time graph plotting tool. Gain instant insights and make informed decisions today!
Empowering Insights with Innovative
Features for Enhanced Productivity

Advanced Analytics
Gain deep insights into your data with our powerful analytics tools, empowering informed decision-making processes.

Platform Compatibility
Seamlessly access our platform from any device or operating system, ensuring maximum flexibility and convenience.

Intuitive User Interface
Enjoy a user-friendly interface designed for ease of use, reducing learning curves and maximizing productivity.

Customer Support
Access our team of experts for personalized assistance and dedicated support, ensuring a smooth experience at every stage.
About Us
Bringing Your Vision to Life with Creative Expertise
Innovative Solutions
We pride ourselves on offering innovative solutions that push the boundaries of technology and creativity to deliver exceptional results.
Client-Centric Approach
Our client-centric approach ensures that your needs are at the forefront of everything we do. We prioritize communication, collaboration, and transparency to build lasting partnerships.
Expert Team
Our team consists of skilled professionals who are passionate about their craft. With expertise in various disciplines, we're equipped to tackle any challenge and deliver outstanding outcomes for our clients.
Instant Graphing
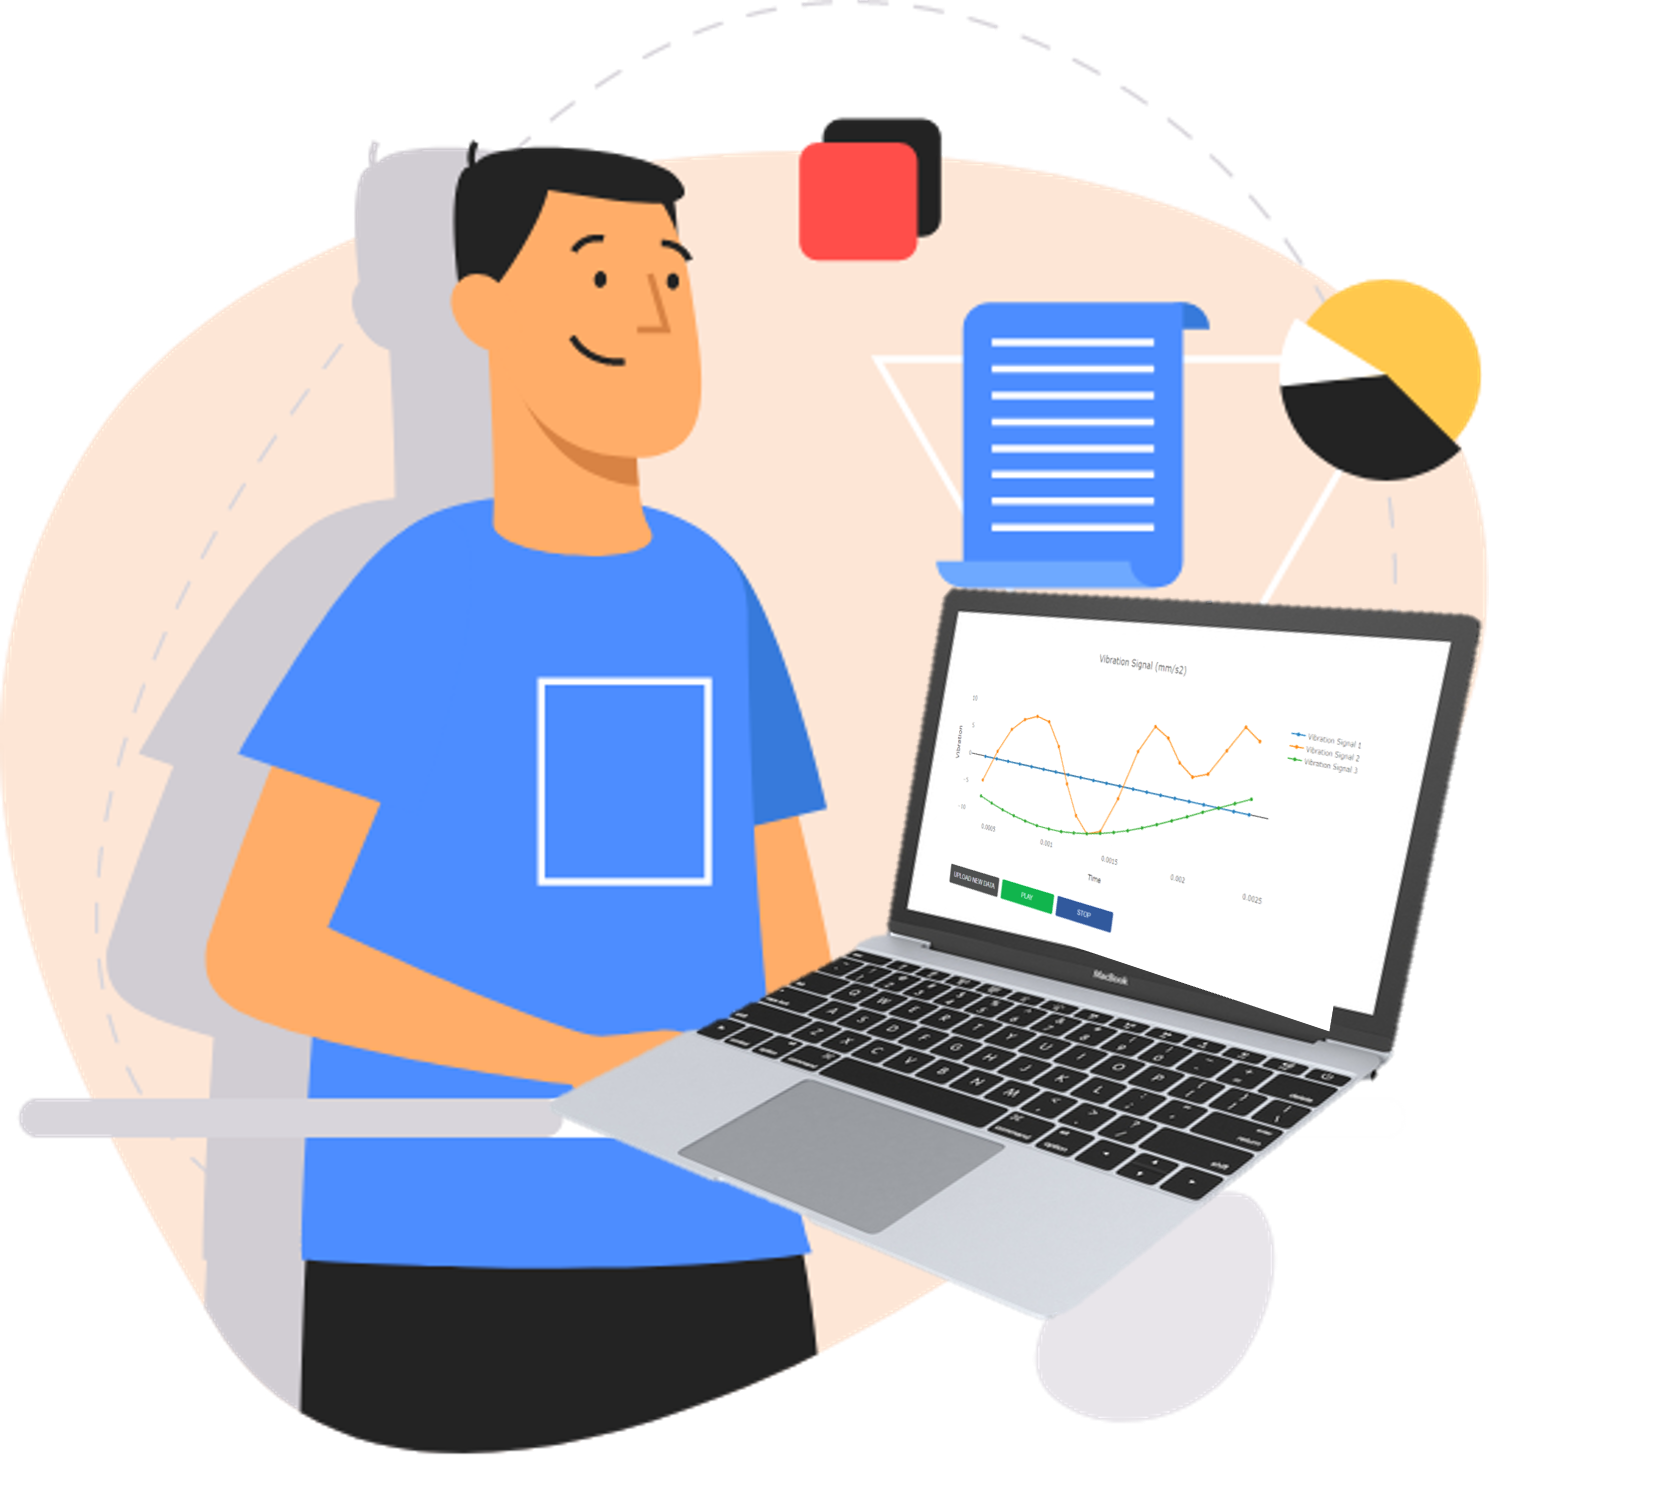
Live Data Visualization
Experience instant visualization of time and vibration data, empowering real-time analysis to uncover trends and patterns with our intuitive graphing tool. Dive in now!
Rapid Visualization: Instantly plot data for quick insights.
Dynamic Graphs: Watch as graphs adapt to uploaded datasets.
On-the-Fly Analysis: Analyze trends as they happen with live updates.
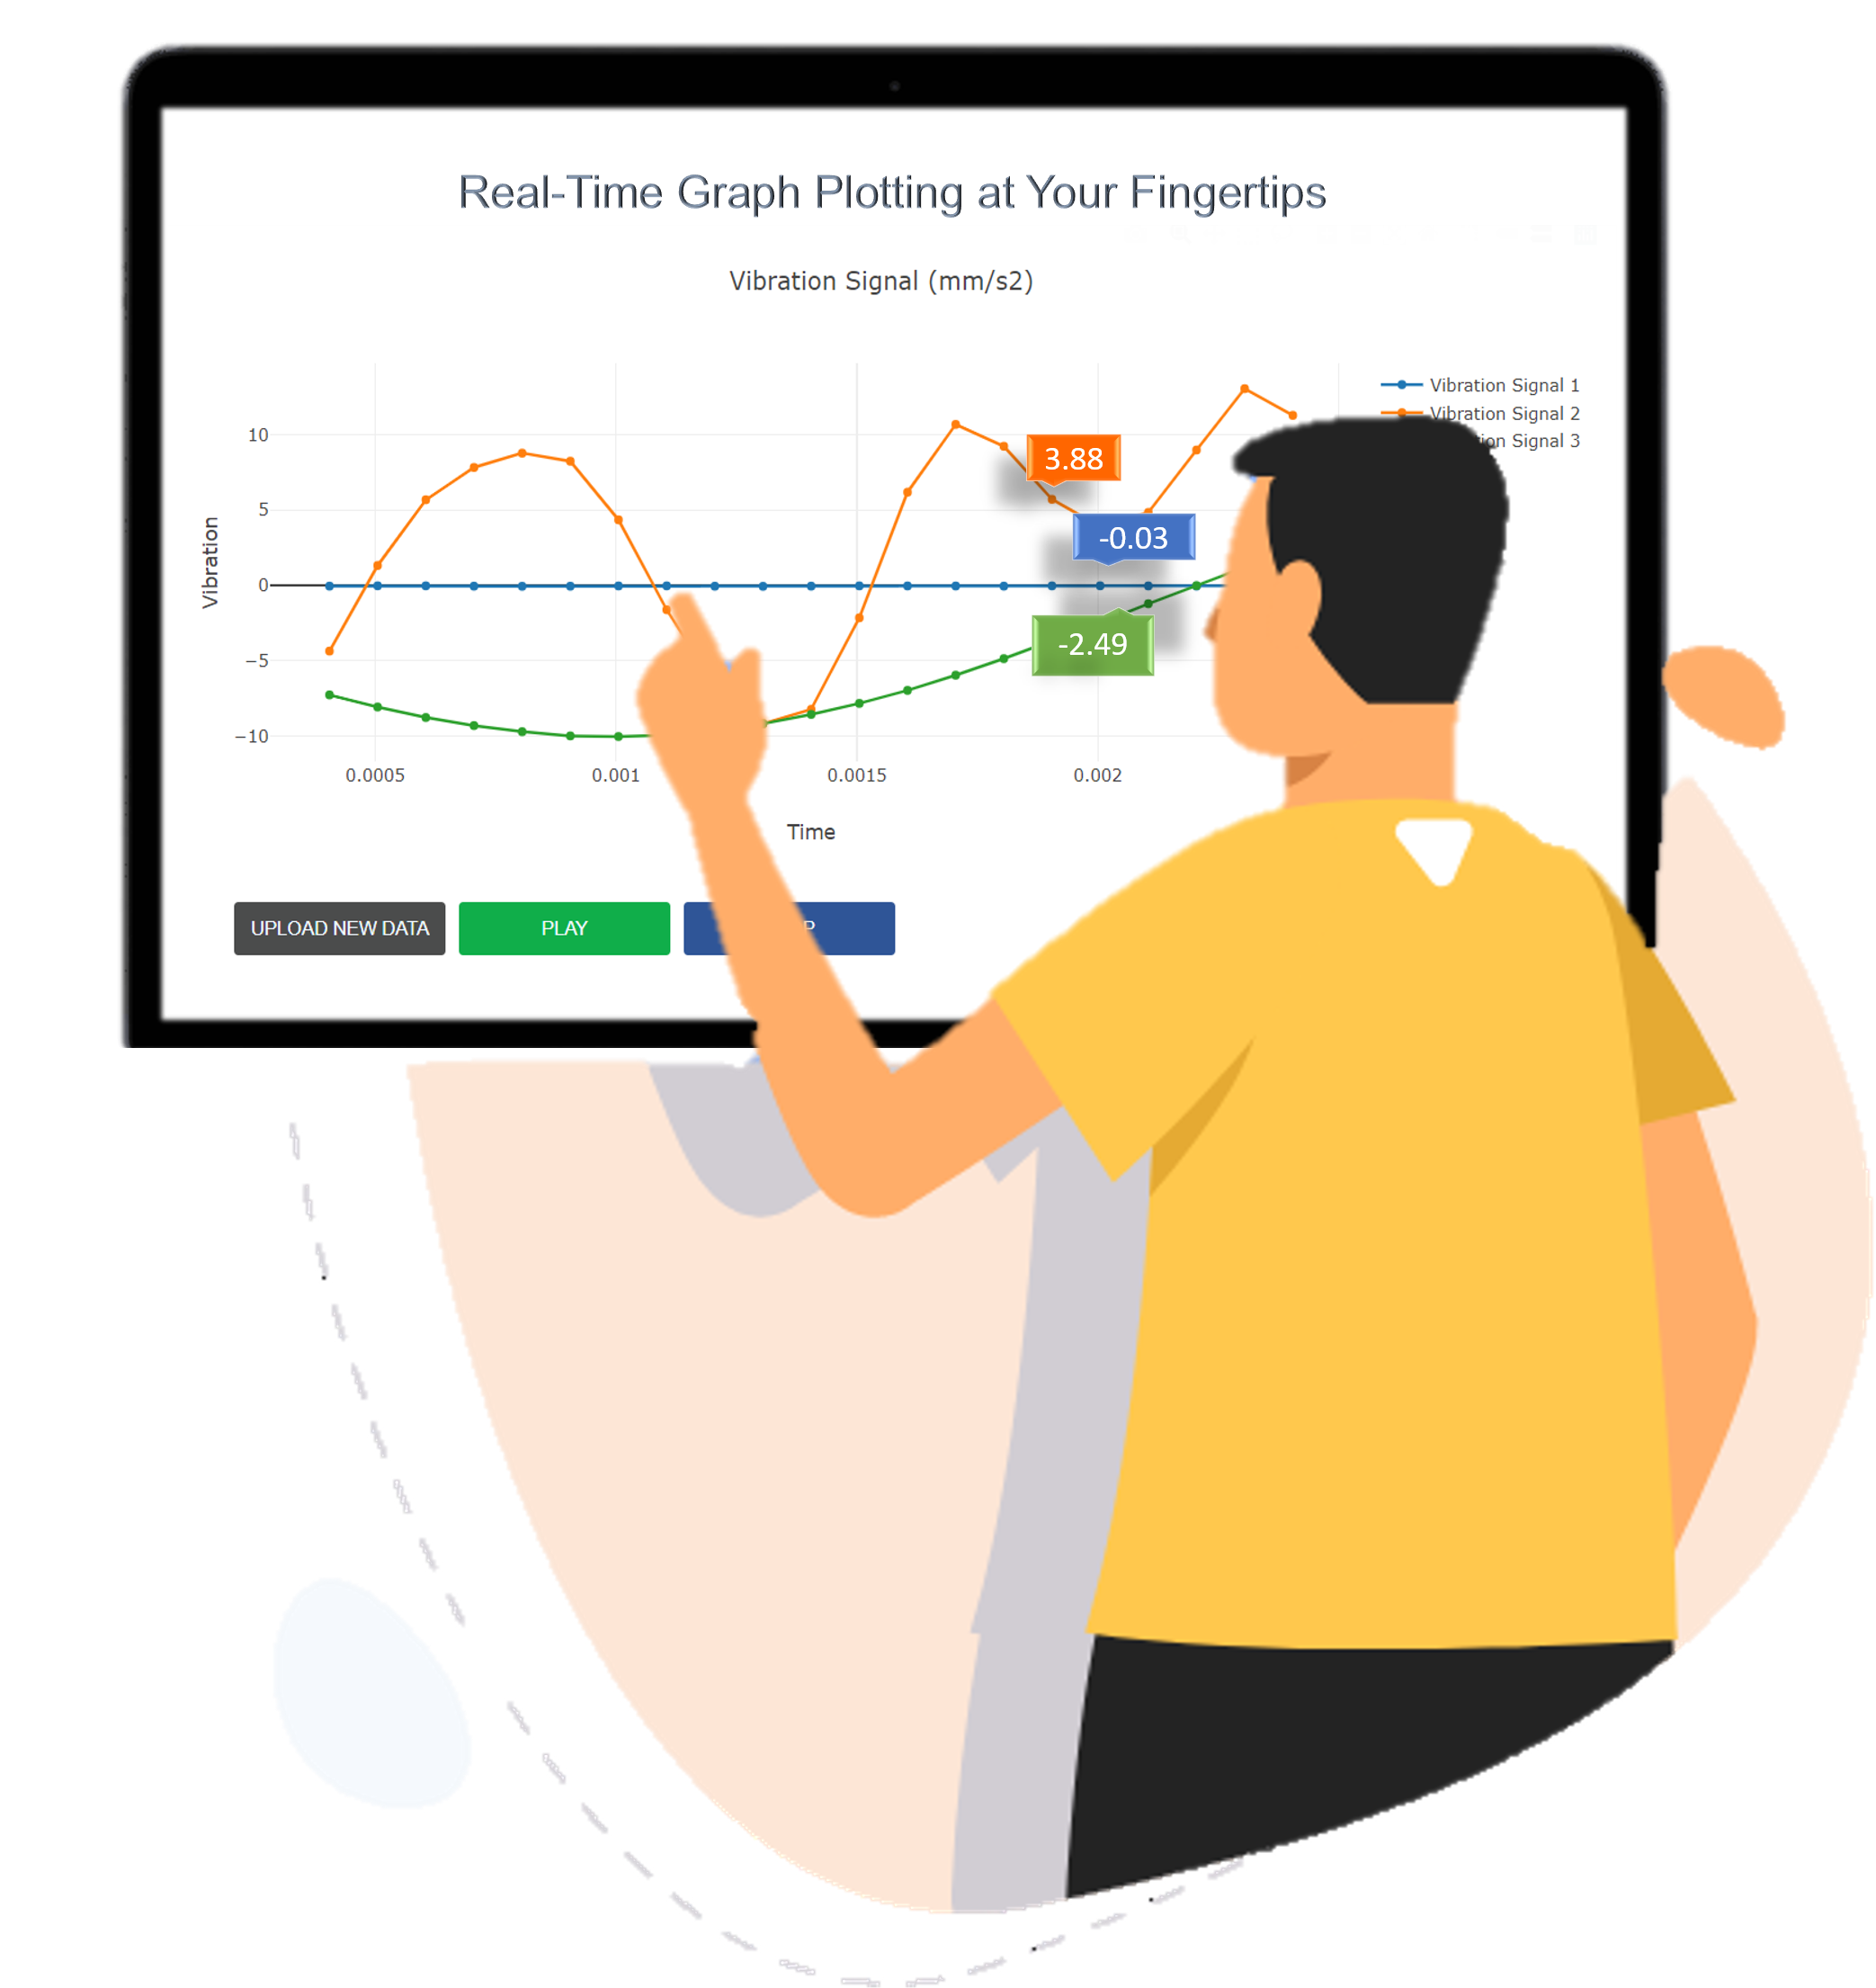
Real-Time Plotting
Time and Vibration Data
Experience the power of real-time visualization with our website's ability to instantly plot time and vibration datasets. Gain actionable insights as your data comes to life through dynamic graphs.
Time and Vibration Analysis
Upload your time and vibration datasets to visualize patterns and trends in real-time.
Responsive Graphs
Explore your data effortlessly with responsive graphs that adapt to your input, providing a seamless visualization experience.
Live Updates
Stay informed with live updates as your data is plotted, enabling quick analysis and decision-making.
Need Help? Contact Us
Have questions or need assistance?
Reach out to us for
prompt and expert support.
User Testimonials
Real Experiences Shared by Our Valued Users from Across the Globe
" This company's live graph plot service for vibration data is a game-changer! The ability to analyze data in real-time has significantly improved our predictive maintenance strategies
- Abdul Raza
" The live graph plot feature provided by this company has revolutionized how we monitor vibration data. It's user-friendly and has become an indispensable tool in our operation
- Owais
" Impressed by the real-time visualization of vibration data on the live graph plot! It's been instrumental in monitoring our equipment health. Highly recommended
- Deepak
Unlock the power of your data with our real-time graph plotting tool. Gain instant insights and make informed decisions today!
Quick Links
For Assistance or Inquiries, Please Contact Us
- Call: +447570664041
- Email: satvilka@lsbu.ac.uk
© 2024 Graphify All Rights Reserved.
Developed by Graphify Team